
New York Rangers at Dallas Stars
· National Hockey League
0 - 2

Robertson scores twice, Oettinger earns shutout as Stars beat Rangers 2-0 and clinch 2nd in Central

The Stars were already assured of facing the Minnesota Wild in the first round of the NHL playoffs. They secured the position late in the third period when the Nashville Predators.
Robertson collected a rebound of Matt Duchene’s shot and flipped a backhander into the far side to beat Igor Shesterkin with 7:11 left to play. Robertson has 44 goals, two short of his career high scored three years ago.
Duchene assisted on both goals.
It was Oettinger’s 34th win of the season. He was on the U.S. men's team that Rangers coach Mike Sullivan led to the gold medal at the Milan Cortina Olympics.
Shesterkin stopped 17 shots while absorbing only his second regulation loss in 10 career decisions against Dallas.
The Rangers began a season-ending three-game road trip. They’re last in the Eastern Conference and will miss the playoffs for a second straight season after winning the Presidents’ Trophy in 2024.
The Rangers, with the second-best road power play in the league, went 0 for 5 with the man advantage. That included 1:02 of 5-on-3 late in the second period.
Series tied 1-1
Scoring Summary
 |
Goal | 3rd Period 12:49 | Jason Robertson Goal (43) Backhand, assists: Matt Duchene (25), Wyatt Johnston (41) |
|
Goal | 3rd Period 19:01 | Jason Robertson Goal (44) Backhand, assists: Matt Duchene (26), Mavrik Bourque (20) |
Statistics
 NYR NYR |
 DAL DAL |
|
|---|---|---|
| 9 | Blocked Shots | 19 |
| 22 | Hits | 14 |
| 6 | Takeaways | 3 |
| 22 | Shots | 19 |
| 0 | Power Play Goals | 1 |
| 5 | Power Play Opportunities | 4 |
| 0.0 | Power Play Percentage | 25.0 |
| 0 | Short Handed Goals | 0 |
| 0 | Shootout Goals | 0 |
| 25 | Faceoffs Won | 21 |
| 54.3 | Faceoff Win Percent | 45.7 |
| 13 | Giveaways | 14 |
| 5 | Total Penalties | 7 |
| 15 | Penalty Minutes | 17 |
 Dallas Stars Injuries
| NAME, POS | STATUS | DATE |
|---|---|---|
| Arttu Hyry, RW | Out | Jul 1 |
| Roope Hintz, C | Out | May 4 |
| Tyler Seguin, C | Injured Reserve | May 4 |
| Nils Lundkvist, D | Out | Apr 29 |
 New York Rangers Injuries
| NAME, POS | STATUS | DATE |
|---|---|---|
| Matt Rempe, C | Injured Reserve | Mar 23 |
Game Information
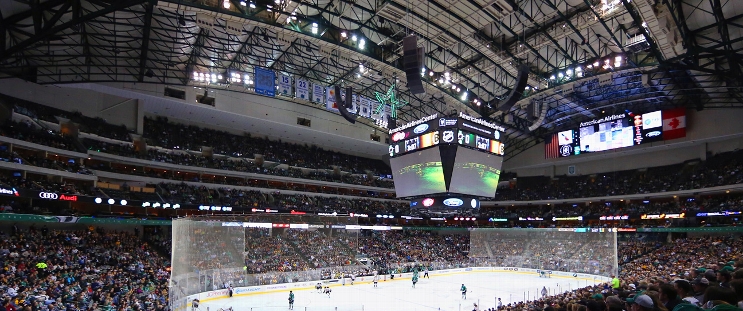 American Airlines Center
Location: Dallas, TX
Attendance: 18,532 | Capacity:
Location: Dallas, TX
Attendance: 18,532 | Capacity:
2025-26 Metropolitan Division Standings
| TEAM | W | L | PTS | OTL |
|---|---|---|---|---|
| <img src="https://a.espncdn.com/i/teamlogos/nhl/500/car.png" style="padding: 0 4px; width: 25px; vertical-align: inherit;">Carolina | 53 | 22 | 113 | 7 |
| <img src="https://a.espncdn.com/i/teamlogos/nhl/500/pit.png" style="padding: 0 4px; width: 25px; vertical-align: inherit;">Pittsburgh | 41 | 25 | 98 | 16 |
| <img src="https://a.espncdn.com/i/teamlogos/nhl/500/phi.png" style="padding: 0 4px; width: 25px; vertical-align: inherit;">Philadelphia | 43 | 27 | 98 | 12 |
| <img src="https://a.espncdn.com/i/teamlogos/nhl/500/wsh.png" style="padding: 0 4px; width: 25px; vertical-align: inherit;">Washington | 43 | 30 | 95 | 9 |
| <img src="https://a.espncdn.com/i/teamlogos/nhl/500/cbj.png" style="padding: 0 4px; width: 25px; vertical-align: inherit;">Columbus | 40 | 30 | 92 | 12 |
| <img src="https://a.espncdn.com/i/teamlogos/nhl/500/nyi.png" style="padding: 0 4px; width: 25px; vertical-align: inherit;">NY Islanders | 43 | 34 | 91 | 5 |
| <img src="https://a.espncdn.com/i/teamlogos/nhl/500/nj.png" style="padding: 0 4px; width: 25px; vertical-align: inherit;">New Jersey | 42 | 37 | 87 | 3 |
| <img src="https://a.espncdn.com/i/teamlogos/nhl/500/nyr.png" style="padding: 0 4px; width: 25px; vertical-align: inherit;">NY Rangers | 34 | 39 | 77 | 9 |
2025-26 Central Division Standings
| TEAM | W | L | PTS | OTL |
|---|---|---|---|---|
| <img src="https://a.espncdn.com/i/teamlogos/nhl/500/col.png" style="padding: 0 4px; width: 25px; vertical-align: inherit;">Colorado | 55 | 16 | 121 | 11 |
| <img src="https://a.espncdn.com/i/teamlogos/nhl/500/dal.png" style="padding: 0 4px; width: 25px; vertical-align: inherit;">Dallas | 50 | 20 | 112 | 12 |
| <img src="https://a.espncdn.com/i/teamlogos/nhl/500/min.png" style="padding: 0 4px; width: 25px; vertical-align: inherit;">Minnesota | 46 | 24 | 104 | 12 |
| <img src="https://a.espncdn.com/i/teamlogos/nhl/500/uta.png" style="padding: 0 4px; width: 25px; vertical-align: inherit;">Utah | 43 | 33 | 92 | 6 |
| <img src="https://a.espncdn.com/i/teamlogos/nhl/500/stl.png" style="padding: 0 4px; width: 25px; vertical-align: inherit;">St. Louis | 37 | 33 | 86 | 12 |
| <img src="https://a.espncdn.com/i/teamlogos/nhl/500/nsh.png" style="padding: 0 4px; width: 25px; vertical-align: inherit;">Nashville | 38 | 34 | 86 | 10 |
| <img src="https://a.espncdn.com/i/teamlogos/nhl/500/wpg.png" style="padding: 0 4px; width: 25px; vertical-align: inherit;">Winnipeg | 35 | 35 | 82 | 12 |
| <img src="https://a.espncdn.com/i/teamlogos/nhl/500/chi.png" style="padding: 0 4px; width: 25px; vertical-align: inherit;">Chicago | 29 | 39 | 72 | 14 |