
Anaheim Ducks at Winnipeg Jets
· National Hockey League
4 - 1

Ducks’ second-period outburst helps to sink Jets 4-1

Alex Killorn and Jackson LaCombe also registered a goal and an assist. Tim Washe also scored for Anaheim. Lukas Dostal made 12 saves for the Ducks, who rebounded from a 4-0 loss to St. Louis on Sunday.
Morgan Barron scored for Winnipeg. Connor Hellebuyck had 30 saves for the Jets, who saw their three-game win streak and six-game point streak halted.
After a scoreless first period in which Anaheim outshot Winnipeg 8-2, the Jets opened the scoring at 5:04 of the second when Barron notched his 10th of the season, assisted by Elias Salomonsson and Cole Perfetti.
The Ducks quickly flipped the script, scoring three times in less than two minutes. Washe tied the game at 6:24 and Poehling gave Anaheim the lead just 14 seconds later. Killorn added the insurance marker at 8:08 to give the visitors a two-goal lead.
The Ducks outscored the Jets 12-6 in three games this year. The win keeps the Ducks in first place in the Pacific Division, while continuing a hot run for goaltender Dostal, who has now won 13 of his last 15 games.
Jets host the New York Rangers on Thursday.
Regular Season SeriesANA wins series 3-0
Scoring Summary
 |
Goal | 2nd Period 5:04 | Morgan Barron Goal (10) Tip-In, assists: Elias Salomonsson (1), Cole Perfetti (15) |
 |
Goal | 2nd Period 6:24 | Tim Washe Goal (2) Snap Shot, assists: Jansen Harkins (4), Radko Gudas (11) |
|
Goal | 2nd Period 6:38 | Ryan Poehling Goal (8) Tip-In, assists: Alex Killorn (13), Jackson LaCombe (37) |
|
Goal | 2nd Period 8:08 | Alex Killorn Goal (9) Wrist Shot, assists: Ryan Poehling (19) |
|
Goal | 3rd Period 19:34 | Jackson LaCombe Goal (8) Wrist Shot, assists: Jacob Trouba (21) |
Statistics
 ANA ANA |
 WPG WPG |
|
|---|---|---|
| 11 | Blocked Shots | 12 |
| 15 | Hits | 15 |
| 4 | Takeaways | 3 |
| 35 | Shots | 13 |
| 0 | Power Play Goals | 0 |
| 2 | Power Play Opportunities | 3 |
| 0.0 | Power Play Percentage | 0.0 |
| 0 | Short Handed Goals | 0 |
| 0 | Shootout Goals | 0 |
| 22 | Faceoffs Won | 29 |
| 43.1 | Faceoff Win Percent | 56.9 |
| 13 | Giveaways | 12 |
| 3 | Total Penalties | 2 |
| 6 | Penalty Minutes | 4 |
 Winnipeg Jets Injuries
| NAME, POS | STATUS | DATE |
|---|---|---|
| Elias Salomonsson, D | Out | Apr 30 |
| Neal Pionk, D | Out | Apr 16 |
| Vladislav Namestnikov, C | Out | Apr 16 |
| Gustav Nyquist, RW | Out | Apr 16 |
| Alex Iafallo, LW | Out | Apr 16 |
 Anaheim Ducks Injuries
| NAME, POS | STATUS | DATE |
|---|---|---|
| Nick Jensen, D | Out | Jul 4 |
| Petr Mrazek, G | Out | Jun 29 |
| Troy Terry, RW | Out | Jun 18 |
| Drew Helleson, D | Out | May 14 |
| Ryan Poehling, C | Out | May 13 |
Game Information
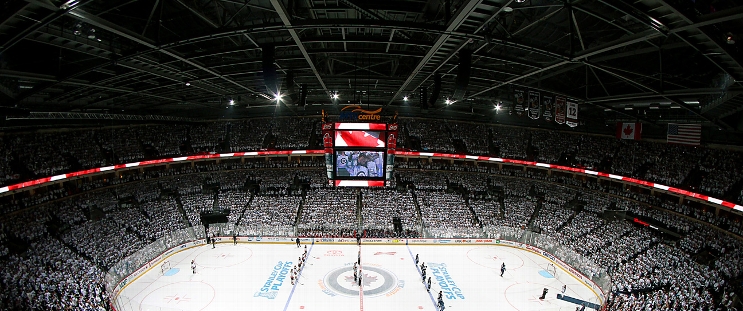 Canada Life Centre
Location: Winnipeg,
Attendance: 13,249 | Capacity:
Location: Winnipeg,
Attendance: 13,249 | Capacity:
2025-26 Pacific Division Standings
| TEAM | W | L | PTS | OTL |
|---|---|---|---|---|
| <img src="https://a.espncdn.com/i/teamlogos/nhl/500/vgk.png" style="padding: 0 4px; width: 25px; vertical-align: inherit;">Vegas | 39 | 26 | 95 | 17 |
| <img src="https://a.espncdn.com/i/teamlogos/nhl/500/edm.png" style="padding: 0 4px; width: 25px; vertical-align: inherit;">Edmonton | 41 | 30 | 93 | 11 |
| <img src="https://a.espncdn.com/i/teamlogos/nhl/500/ana.png" style="padding: 0 4px; width: 25px; vertical-align: inherit;">Anaheim | 43 | 33 | 92 | 6 |
| <img src="https://a.espncdn.com/i/teamlogos/nhl/500/la.png" style="padding: 0 4px; width: 25px; vertical-align: inherit;">Los Angeles | 35 | 27 | 90 | 20 |
| <img src="https://a.espncdn.com/i/teamlogos/nhl/500/sj.png" style="padding: 0 4px; width: 25px; vertical-align: inherit;">San Jose | 39 | 35 | 86 | 8 |
| <img src="https://a.espncdn.com/i/teamlogos/nhl/500/sea.png" style="padding: 0 4px; width: 25px; vertical-align: inherit;">Seattle | 34 | 37 | 79 | 11 |
| <img src="https://a.espncdn.com/i/teamlogos/nhl/500/cgy.png" style="padding: 0 4px; width: 25px; vertical-align: inherit;">Calgary | 34 | 39 | 77 | 9 |
| <img src="https://a.espncdn.com/i/teamlogos/nhl/500/van.png" style="padding: 0 4px; width: 25px; vertical-align: inherit;">Vancouver | 25 | 49 | 58 | 8 |
2025-26 Central Division Standings
| TEAM | W | L | PTS | OTL |
|---|---|---|---|---|
| <img src="https://a.espncdn.com/i/teamlogos/nhl/500/col.png" style="padding: 0 4px; width: 25px; vertical-align: inherit;">Colorado | 55 | 16 | 121 | 11 |
| <img src="https://a.espncdn.com/i/teamlogos/nhl/500/dal.png" style="padding: 0 4px; width: 25px; vertical-align: inherit;">Dallas | 50 | 20 | 112 | 12 |
| <img src="https://a.espncdn.com/i/teamlogos/nhl/500/min.png" style="padding: 0 4px; width: 25px; vertical-align: inherit;">Minnesota | 46 | 24 | 104 | 12 |
| <img src="https://a.espncdn.com/i/teamlogos/nhl/500/uta.png" style="padding: 0 4px; width: 25px; vertical-align: inherit;">Utah | 43 | 33 | 92 | 6 |
| <img src="https://a.espncdn.com/i/teamlogos/nhl/500/stl.png" style="padding: 0 4px; width: 25px; vertical-align: inherit;">St. Louis | 37 | 33 | 86 | 12 |
| <img src="https://a.espncdn.com/i/teamlogos/nhl/500/nsh.png" style="padding: 0 4px; width: 25px; vertical-align: inherit;">Nashville | 38 | 34 | 86 | 10 |
| <img src="https://a.espncdn.com/i/teamlogos/nhl/500/wpg.png" style="padding: 0 4px; width: 25px; vertical-align: inherit;">Winnipeg | 35 | 35 | 82 | 12 |
| <img src="https://a.espncdn.com/i/teamlogos/nhl/500/chi.png" style="padding: 0 4px; width: 25px; vertical-align: inherit;">Chicago | 29 | 39 | 72 | 14 |