
Anaheim Ducks at Minnesota Wild
· National Hockey League
2 - 3

Wallstedt makes 35 saves for Wild in a 3-2 win over the Ducks in a playoff tuneup for both teams

Danila Yurov and Robby Fabbri also scored for the playoff -bound Wild, who have won 21 of their last 22 games against the Ducks, including eight in a row.
Wallstedt, who is second in the NHL in save percentage, went 18-9-6 in his debut and has given the Wild plenty to consider for a potential postseason goalie rotation with Filip Gustavsson. Wallstedt allowed only 12 goals over his last six starts.
Mason McTavish scored on a power play in the first period and again on a tip-in with 45 seconds left for the Ducks, who clinched their first spot in the Stanley Cup playoffs since 2018 during an off night on Monday when Nashville lost to San Jose.
The Ducks, who have 90 points with one game left, are 1-6-2 in their last eight games. They can no longer win the Pacific Division and could still fall to the second wild-card spot, which would match up with Presidents’ Trophy winner Colorado in the first round.
Anaheim hasn’t won a playoff series since a second round victory over Edmonton in 2017, though that’s two years more recent than Minnesota’s last postseason advancement.
The Wild, who rested 10 regular skaters, giving Haight, the team’s 2022 second-round draft pick, an opportunity as the second line center in his eighth NHL game. He ripped a shot from the slot in the second period to get on the board.
Minnesota: Faces Dallas in the first round of the playoffs, starting on the road on Saturday or Sunday.
Regular Season SeriesMIN wins series 3-0
Scoring Summary
 |
Goal | 1st Period 10:27 | Mason McTavish Goal (16) Wrist Shot, assists: Jackson LaCombe (48), Ryan Poehling (24) |
 |
Goal | 1st Period 16:42 | Danila Yurov Goal (12) Wrist Shot, assists: Vladimir Tarasenko (24) |
|
Goal | 2nd Period 11:24 | Hunter Haight Goal (1) Wrist Shot, assists: Nick Foligno (11), Marcus Johansson (34) |
|
Goal | 3rd Period 13:03 | Robby Fabbri Goal (2) Wrist Shot, assists: Nicolas Aube-Kubel (2), Ben Jones (2) |
|
Goal | 3rd Period 19:14 | Mason McTavish Goal (17) Tip-In, assists: Mikael Granlund (19), Cutter Gauthier (28) |
Statistics
 ANA ANA |
 MIN MIN |
|
|---|---|---|
| 7 | Blocked Shots | 16 |
| 16 | Hits | 25 |
| 4 | Takeaways | 8 |
| 37 | Shots | 20 |
| 1 | Power Play Goals | 0 |
| 3 | Power Play Opportunities | 1 |
| 33.3 | Power Play Percentage | 0.0 |
| 0 | Short Handed Goals | 0 |
| 0 | Shootout Goals | 0 |
| 31 | Faceoffs Won | 27 |
| 53.4 | Faceoff Win Percent | 46.6 |
| 27 | Giveaways | 10 |
| 2 | Total Penalties | 4 |
| 4 | Penalty Minutes | 8 |
 Minnesota Wild Injuries
| NAME, POS | STATUS | DATE |
|---|---|---|
| Zach Bogosian, D | Out | Jul 1 |
| Filip Gustavsson, G | Out | May 18 |
| Jonas Brodin, D | Out | May 13 |
| Joel Eriksson Ek, C | Out | May 13 |
| Charlie Stramel, C | Out | Apr 6 |
 Anaheim Ducks Injuries
| NAME, POS | STATUS | DATE |
|---|---|---|
| Nick Jensen, D | Out | Jul 4 |
| Petr Mrazek, G | Out | Jun 29 |
| Troy Terry, RW | Out | Jun 18 |
| Drew Helleson, D | Out | May 14 |
| Ryan Poehling, C | Out | May 13 |
Game Information
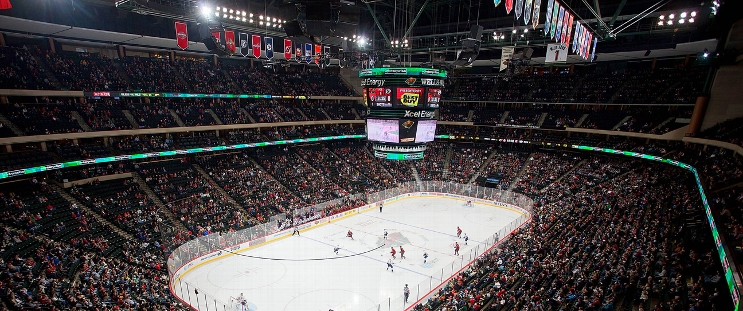 Grand Casino Arena
Location: Saint Paul, MN
Attendance: 19,008 | Capacity:
Location: Saint Paul, MN
Attendance: 19,008 | Capacity:
2025-26 Pacific Division Standings
| TEAM | W | L | PTS | OTL |
|---|---|---|---|---|
| <img src="https://a.espncdn.com/i/teamlogos/nhl/500/vgk.png" style="padding: 0 4px; width: 25px; vertical-align: inherit;">Vegas | 39 | 26 | 95 | 17 |
| <img src="https://a.espncdn.com/i/teamlogos/nhl/500/edm.png" style="padding: 0 4px; width: 25px; vertical-align: inherit;">Edmonton | 41 | 30 | 93 | 11 |
| <img src="https://a.espncdn.com/i/teamlogos/nhl/500/ana.png" style="padding: 0 4px; width: 25px; vertical-align: inherit;">Anaheim | 43 | 33 | 92 | 6 |
| <img src="https://a.espncdn.com/i/teamlogos/nhl/500/la.png" style="padding: 0 4px; width: 25px; vertical-align: inherit;">Los Angeles | 35 | 27 | 90 | 20 |
| <img src="https://a.espncdn.com/i/teamlogos/nhl/500/sj.png" style="padding: 0 4px; width: 25px; vertical-align: inherit;">San Jose | 39 | 35 | 86 | 8 |
| <img src="https://a.espncdn.com/i/teamlogos/nhl/500/sea.png" style="padding: 0 4px; width: 25px; vertical-align: inherit;">Seattle | 34 | 37 | 79 | 11 |
| <img src="https://a.espncdn.com/i/teamlogos/nhl/500/cgy.png" style="padding: 0 4px; width: 25px; vertical-align: inherit;">Calgary | 34 | 39 | 77 | 9 |
| <img src="https://a.espncdn.com/i/teamlogos/nhl/500/van.png" style="padding: 0 4px; width: 25px; vertical-align: inherit;">Vancouver | 25 | 49 | 58 | 8 |
2025-26 Central Division Standings
| TEAM | W | L | PTS | OTL |
|---|---|---|---|---|
| <img src="https://a.espncdn.com/i/teamlogos/nhl/500/col.png" style="padding: 0 4px; width: 25px; vertical-align: inherit;">Colorado | 55 | 16 | 121 | 11 |
| <img src="https://a.espncdn.com/i/teamlogos/nhl/500/dal.png" style="padding: 0 4px; width: 25px; vertical-align: inherit;">Dallas | 50 | 20 | 112 | 12 |
| <img src="https://a.espncdn.com/i/teamlogos/nhl/500/min.png" style="padding: 0 4px; width: 25px; vertical-align: inherit;">Minnesota | 46 | 24 | 104 | 12 |
| <img src="https://a.espncdn.com/i/teamlogos/nhl/500/uta.png" style="padding: 0 4px; width: 25px; vertical-align: inherit;">Utah | 43 | 33 | 92 | 6 |
| <img src="https://a.espncdn.com/i/teamlogos/nhl/500/stl.png" style="padding: 0 4px; width: 25px; vertical-align: inherit;">St. Louis | 37 | 33 | 86 | 12 |
| <img src="https://a.espncdn.com/i/teamlogos/nhl/500/nsh.png" style="padding: 0 4px; width: 25px; vertical-align: inherit;">Nashville | 38 | 34 | 86 | 10 |
| <img src="https://a.espncdn.com/i/teamlogos/nhl/500/wpg.png" style="padding: 0 4px; width: 25px; vertical-align: inherit;">Winnipeg | 35 | 35 | 82 | 12 |
| <img src="https://a.espncdn.com/i/teamlogos/nhl/500/chi.png" style="padding: 0 4px; width: 25px; vertical-align: inherit;">Chicago | 29 | 39 | 72 | 14 |